At ABC Corp, we understand that understanding your inventory management system is critical to your business success. One key inventory metric you should familiarize yourself with is “Inventory Days on Hand.” Let’s delve into this comprehensive guide.
What Are Inventory Days On Hand?
Inventory Days On Hand (DOH) is a critical measure of inventory management. This metric shows the average number of days a product stays in the warehouse before it’s sold. Effectively managing DOH helps businesses achieve optimal inventory levels, reducing holding costs and improving cash flow.
The Crucial Nature of Inventory DOH
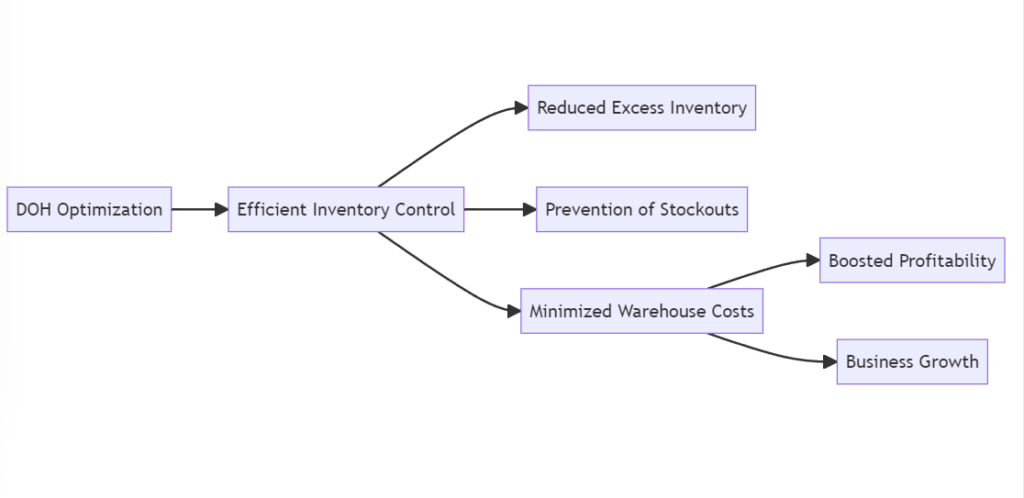
A well-calibrated DOH metric aids in efficient inventory control. It helps reduce excess inventory, prevents stockouts, and minimizes warehouse costs, boosting profitability and business growth.
How to Calculate Inventory Days On Hand
Inventory Days On Hand (DOH) represents the average length of time items remain in your inventory before they are sold. This critical inventory management metric provides insights into your inventory’s efficiency and turnover rate. Here is a step-by-step guide on how to calculate Inventory DOH:
Calculating Inventory Days On Hand
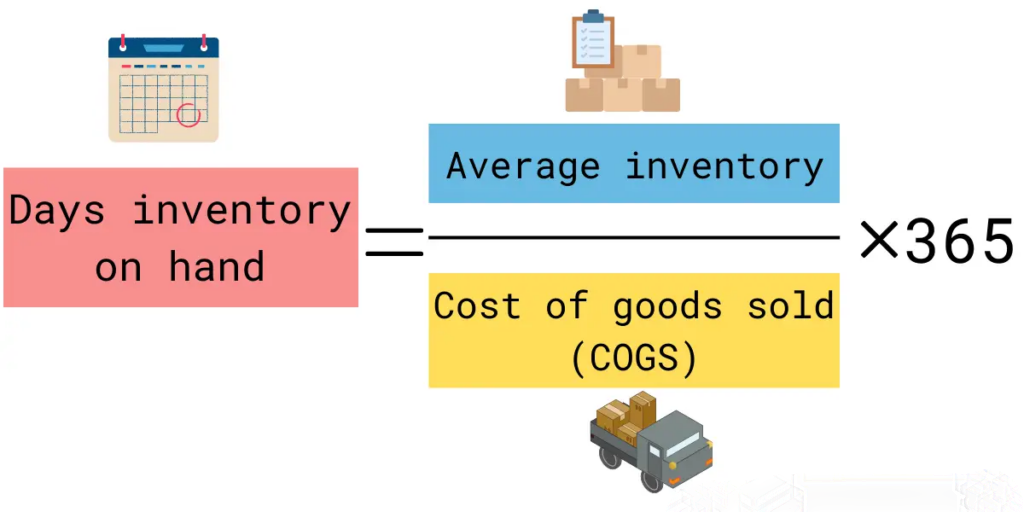
To calculate Inventory Days On Hand, you need two key figures: the average inventory and the cost of goods sold (COGS).
- Average Inventory: This is the mean value of your inventory during a specific period. It can be calculated by adding the inventory value at the start of the period to the inventory value at the end, then dividing by two.
- Cost of Goods Sold (COGS): This is the total cost of all items sold during a specific period. It includes the cost of producing the goods or the purchase price of the goods.
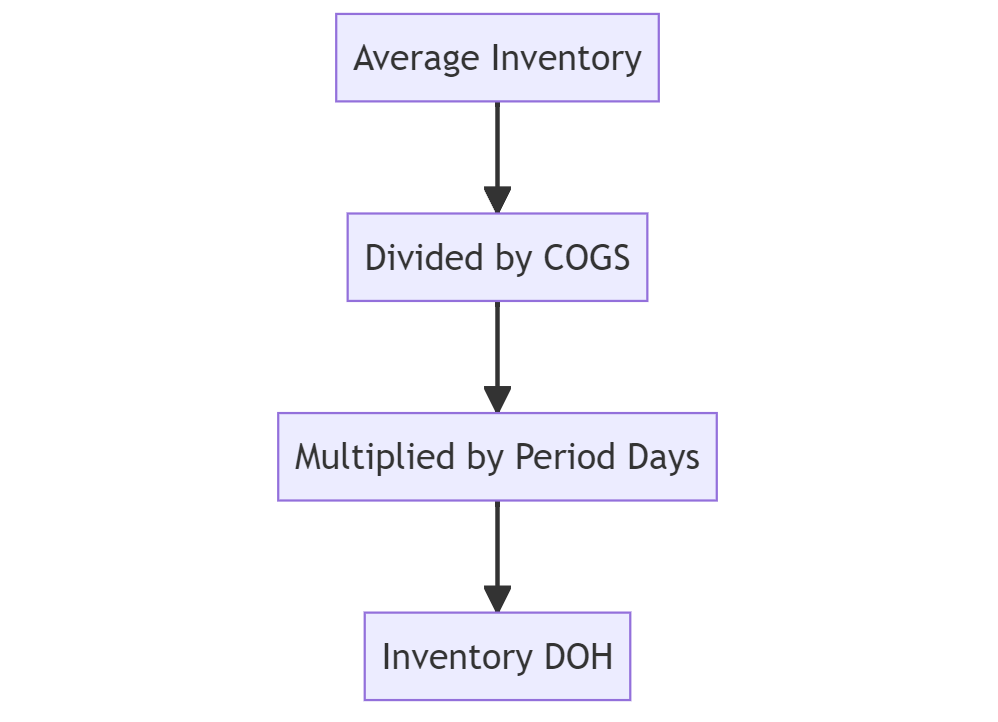
Once you have these two figures, you can calculate Inventory DOH using the following formula:
Inventory DOH = (Average Inventory / COGS) * Number of days in the period
For example, if your average inventory for a quarter (365 days) is $500,000 and your COGS for the same period is $600,000, the Inventory DOH would be:
Inventory DOH = ($500,000 / $600,000) * 365 = 304 days
This means, on average, inventory items stay in your warehouse for 304 days before they are sold.
This calculation helps businesses understand their inventory turnover rate and efficiency.
Implications of High and Low DOH
A high DOH indicates that products are not selling quickly, potentially leading to excess storage costs. In contrast, a low DOH shows a faster product turnover, potentially leading to stockouts and missed sales opportunities.
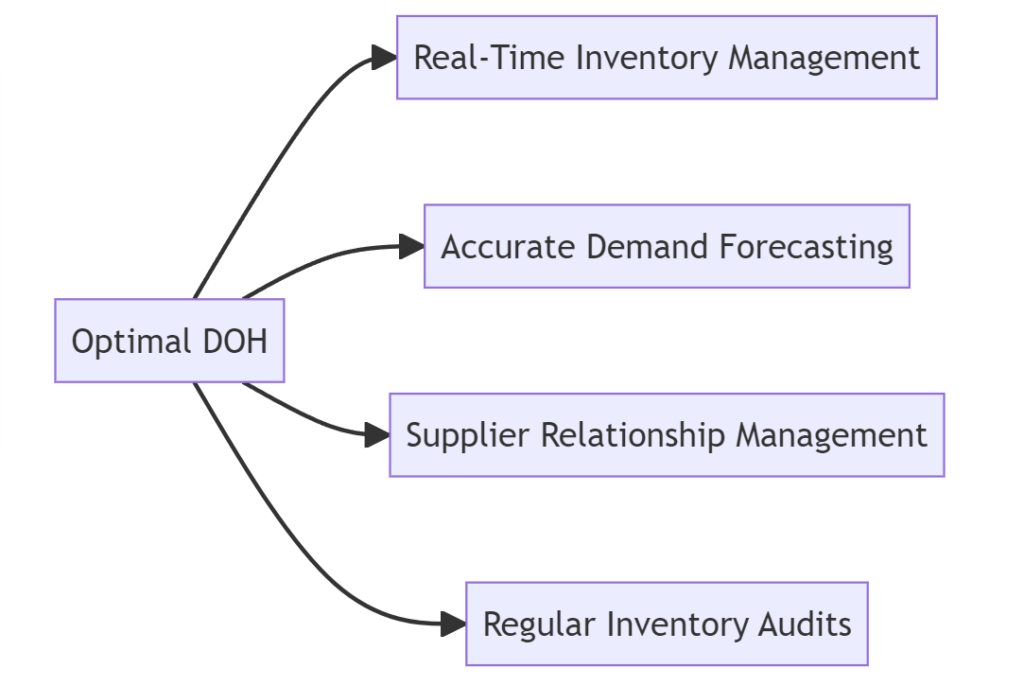
Strategies for Optimal Inventory DOH
Real-Time Inventory Management
A real-time inventory management system provides up-to-date information about your stock levels, ensuring an efficient process in handling orders and maintaining appropriate DOH.
Accurate Demand Forecasting
Accurate demand forecasting allows for efficient inventory control. With a precise understanding of market trends, seasonal changes, and customer buying patterns, you can keep your DOH at optimal levels.
Supplier Relationship Management
Maintaining a good relationship with suppliers allows for flexible order management. This flexibility can help manage DOH by adjusting order frequency and quantities as required.
Regular Inventory Audits
Regular inventory audits are a great way to keep track of your actual stock levels. These audits will identify discrepancies in your records, helping you maintain optimal DOH.
In conclusion, managing Inventory Days On Hand effectively is key to successful inventory management and overall business success. By implementing the strategies mentioned above, businesses can optimize their DOH, reduce costs, and increase profitability.